The semiconductor industry has been a cornerstone of technological advancement, enabling the development of integrated circuits (ICs) that power modern electronics. Among the critical processes in IC fabrication, plasma etching stands out as a pivotal technique for creating precise patterns on semiconductor wafers. Plasma etching relies on the interaction of reactive plasma species with the wafer surface to selectively remove material, achieving the nanoscale precision required for advanced microelectronics. To ensure process reliability and high product yield, real-time monitoring and control are essential. Optical Emission Spectroscopy (OES) has emerged as a powerful, non-invasive diagnostic tool for monitoring plasma etching processes, providing rich, high-dimensional data on plasma chemistry and process conditions.
OES measures the intensity of light emitted by excited species in the plasma across a range of wavelengths, generating spectral data that reflects the chemical and physical state of the etching environment. However, the high dimensionality of OES data, often comprising thousands of wavelength variables sampled at frequent intervals, poses significant challenges for analysis. The data is characterized by substantial information redundancy, noise, and complex correlations between variables, necessitating advanced multivariable analysis techniques to extract meaningful insights. This article provides a comprehensive exploration of multivariable OES data analysis for semiconductor plasma etching, covering its principles, methodologies, applications, challenges, and future directions. The discussion is structured to offer a rigorous, scientific perspective, with detailed comparisons of techniques and their practical implications.
Fundamentals of Plasma Etching and OES
Plasma Etching in Semiconductor Manufacturing
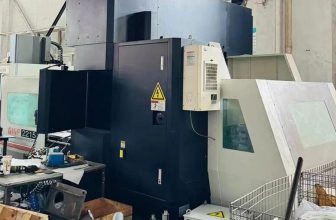
Plasma etching is a dry etching technique widely used in semiconductor manufacturing to create intricate patterns on wafers. Unlike wet etching, which uses liquid chemicals and often results in isotropic etching, plasma etching leverages the anisotropic properties of plasma to achieve high-resolution, directional material removal. The process involves generating a plasma—a partially ionized gas containing ions, electrons, and neutral species—within a vacuum chamber. Reactive gases, such as fluorine- or chlorine-based compounds, are introduced into the chamber and ionized by an energy source, typically radiofrequency (RF) power. The resulting reactive species interact with the wafer surface, breaking chemical bonds and forming volatile byproducts that are removed by the vacuum system.
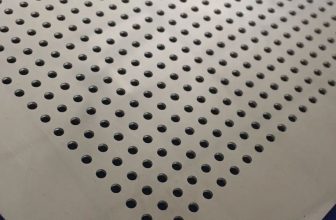
Plasma etching is critical for fabricating features with dimensions approaching atomic scales, as required by modern semiconductor nodes (e.g., 3 nm and below). The process is employed in various applications, including the etching of silicon, silicon dioxide, and metal layers, as well as the formation of trenches, vias, and other microstructures. Key challenges in plasma etching include maintaining uniformity across large wafers, controlling etch rates, ensuring selectivity between materials, and minimizing damage to the substrate. These challenges underscore the need for precise process monitoring and control, where OES plays a central role.
Optical Emission Spectroscopy (OES)
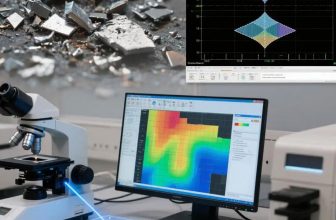
OES is a non-invasive diagnostic technique that analyzes the light emitted by excited species in the plasma. When plasma species (e.g., atoms, ions, or molecules) are energized by collisions with electrons, they transition to higher energy states. As they relax back to lower energy states, they emit photons at characteristic wavelengths, producing a spectrum that serves as a fingerprint of the plasma’s chemical composition. OES systems typically consist of a spectrometer coupled to an optical fiber positioned at a viewport on the etching chamber, capturing spectral data across a wavelength range (e.g., 200–1100 nm) with high resolution.
The resulting OES data is high-dimensional, with intensity measurements recorded for thousands of wavelength channels at regular time intervals (e.g., every second). This temporal and spectral resolution enables real-time monitoring of dynamic process changes, such as shifts in plasma chemistry or the onset of etching endpoints. However, the complexity of OES data—due to overlapping spectral peaks, noise from charge-coupled device (CCD) detectors, and correlations between wavelengths—requires sophisticated multivariable analysis to extract actionable insights.
Multivariable OES Data Analysis: Principles and Objectives
The Need for Multivariable Analysis
OES data’s high dimensionality presents both opportunities and challenges. The rich information content allows for detailed characterization of the plasma etching process, including the detection of faults, prediction of etch rates, and identification of endpoints. However, the sheer volume of data, combined with redundancy and noise, makes manual analysis or simple univariate methods impractical. Multivariable analysis techniques, which consider multiple variables simultaneously, are essential for reducing dimensionality, identifying key features, and modeling relationships between OES data and process outcomes.
The primary objectives of multivariable OES data analysis include:
- Dimension Reduction: Reducing the number of variables (wavelengths) while preserving critical information to simplify analysis and improve computational efficiency.
- Feature Extraction: Identifying spectral features (e.g., peak wavelengths) that are physically meaningful and correlated with process parameters, such as etch rate or uniformity.
- Fault Detection: Detecting anomalies or faults in the etching process in real time to minimize waste and improve yield.
- Endpoint Detection: Determining the precise moment when the target material has been fully etched, critical for preventing over- or under-etching.
- Process Modeling: Developing predictive models that relate OES data to process outcomes, enabling virtual metrology and feedback control.
Key Characteristics of OES Data
OES data exhibits several characteristics that shape the choice of analysis techniques:
- High Dimensionality: A single OES spectrum may include intensity measurements for 2,000–4,000 wavelength channels, with data collected at frequent time points (e.g., 1 Hz) over the duration of an etching step.
- Information Redundancy: Many wavelengths are highly correlated due to the overlapping emission profiles of plasma species, leading to redundant information.
- Noise: CCD detectors introduce noise, which can obscure subtle changes in the spectrum and degrade model performance.
- Temporal Dynamics: OES data is time-series in nature, capturing the evolution of plasma chemistry as the etching process progresses.
- Nonlinearity: The relationship between OES data and process outcomes (e.g., etch rate) is often nonlinear, requiring advanced modeling techniques.
These characteristics necessitate a combination of statistical, machine learning, and signal processing methods to achieve robust analysis.
Multivariable Analysis Techniques for OES Data
Dimension Reduction Methods
Dimension reduction is a critical step in OES data analysis, as it mitigates the curse of dimensionality and reduces computational complexity. Several techniques have been developed to address the high dimensionality of OES data, each with distinct advantages and limitations.
Principal Component Analysis (PCA)
PCA is an unsupervised linear technique that transforms the original high-dimensional OES data into a lower-dimensional space by identifying principal components—orthogonal directions of maximum variance. Each principal component is a linear combination of the original wavelength variables, and the first few components typically capture most of the data’s variability.
Advantages:
- Effective at reducing dimensionality while retaining most of the variance.
- Widely used for endpoint detection and fault detection in plasma etching.
- Computationally efficient for large datasets.
Limitations:
- Assumes linear relationships, which may not capture complex nonlinear patterns in OES data.
- The principal components are abstract and may lack direct physical interpretability.
- Sensitive to noise, which can affect the quality of the reduced dataset.
In practice, PCA is often applied to preprocessed OES data, where noise is filtered using techniques like wavelet transforms. For example, a study on polysilicon etching used PCA to compress OES data and identify the 405 nm wavelength as a key indicator of etching progress.
Internal Information Redundancy Reduction (IIRR)
IIRR is a novel dimension reduction method specifically designed for OES data in plasma etching processes. Unlike PCA, which operates in an abstract variable space, IIRR works directly in the original wavelength space, identifying peak wavelength emissions and their correlative relationships. The method uses a statistic called the Mean Determination Ratio (MDR) to quantify information loss after reduction.
Procedure:
- Peak Selection: Identify prominent wavelength peaks using an Adaptive Peak Selection (APS) algorithm, which detects peaks based on intensity thresholds.
- Correlation Analysis: Evaluate correlations between peaks to eliminate redundant variables.
- Iterative Ranking: Use an Iterative Ranking Process (IRP) and Optimal Peak Selection (OPS) to select a subset of peaks that best represent the original dataset.
Advantages:
- Preserves physical interpretability by retaining actual wavelength variables.
- Achieves significant dimension reduction (e.g., from 2,048 to ~47 peaks) with minimal information loss.
- Demonstrated effectiveness in predicting etch rates in semiconductor manufacturing.
Limitations:
- Computationally intensive due to iterative processes.
- Requires careful tuning of parameters (e.g., peak detection thresholds).
- Less widely adopted than PCA, limiting available benchmarking data.
A study applying IIRR to a semiconductor etching dataset reduced the number of wavelength variables from 2,048 to an average of 47.7 peaks per time point, enabling accurate etch rate prediction with minimal loss of information.
Comparison of Dimension Reduction Techniques
| Technique | Type | Interpretability | Dimension Reduction Ratio | Computational Complexity | Applications |
|---|---|---|---|---|---|
| PCA | Linear, Unsupervised | Low (Abstract Components) | High (90–95% variance retained) | Low | Endpoint Detection, Fault Detection |
| IIRR | Linear, Supervised | High (Physical Wavelengths) | High (e.g., 2,048 to ~47 peaks) | High | Etch Rate Prediction, Process Monitoring |
| Wavelet Transform | Signal Processing | Moderate (Frequency Components) | Variable | Moderate | Noise Reduction, Endpoint Detection |
| Autoencoders | Nonlinear, Unsupervised | Low (Latent Features) | High | High | Advanced Fault Detection, Research |
Feature Extraction and Selection
Feature extraction and selection aim to identify the most relevant wavelength variables for specific applications, such as fault detection or endpoint detection. These methods complement dimension reduction by focusing on physically meaningful features.
Spectra Peak Selection (SPS)
SPS is a simple algorithm that selects the most significant wavelength peaks based on their absolute intensity. The algorithm ranks peaks in descending order and selects the top subset (e.g., 50 peaks) for further analysis. SPS is often combined with wavelet analysis to suppress noise and enhance detection performance.
Advantages:
- Computationally efficient and easy to implement.
- Effective for endpoint detection in small open-area etching processes.
Limitations:
- May overlook subtle but important spectral features.
- Sensitive to noise without preprocessing.
Integrated Squared Response (ISR)
ISR is a sensor variable selection method that evaluates the response of OES wavelengths to manipulated variables (e.g., RF power, gas flow). By constructing a reference sensor library and ranking wavelengths based on ISR, the method identifies variables with strong correlations to process outcomes. ISR is often paired with relative gain array (RGA) techniques for virtual metrology applications.
Advantages:
- Reduces the burden of plasma knowledge for engineers.
- Effective for critical dimension (CD) prediction in plasma etching.
Limitations:
- Requires experimental data on manipulated variables.
- Less effective for highly dynamic processes.
Fault Detection Methods
Fault detection is critical for maintaining process reliability and minimizing wafer scrap. OES-based fault detection leverages the real-time, non-invasive nature of spectral data to identify anomalies.
Similarity Ratio Analysis (SRA)
SRA is a fault detection method that compares real-time OES spectra to a library of healthy process spectra. A Similarity Ratio (SR) statistic is calculated for each spectrum scan, and a 3-Warning-1-Alarm (3W1A) mechanism triggers alerts based on SR thresholds. SRA uses a windowing approach to account for timing uncertainties across process runs.
Procedure:
- Library Construction: Build an SRA library from OES data of healthy etching processes.
- Similarity Calculation: Compute SR for each spectrum scan by comparing it to the library.
- Alarm Triggering: Use the 3W1A mechanism to issue warnings (three consecutive SR anomalies) and alarms (persistent anomalies).
Advantages:
- Enables early-stage fault detection, reducing material waste.
- Robust to timing variations in process runs.
- Demonstrated effectiveness in detecting etch-rate faults.
Limitations:
- Requires a comprehensive library of healthy spectra.
- Performance depends on the quality of the reference data.
Isolation Forest
Isolation Forest is a machine learning-based anomaly detection method that isolates anomalies by recursively partitioning the data space. When applied to OES data, it accounts for isolated variables that may be overlooked by PCA-based methods, offering greater interpretability.
Advantages:
- Effective for high-dimensional, correlated datasets.
- Provides interpretable anomaly scores.
- Suitable for industrial case studies with process faults.
Limitations:
- Computationally intensive for large datasets.
- Requires careful parameter tuning.
Endpoint Detection
Endpoint detection (EPD) is a critical application of OES data analysis, ensuring that etching stops precisely when the target material is removed. Accurate EPD prevents over-etching (which damages the substrate) and under-etching (which leaves residual material).
Principal Component Regression (PCR)
PCR combines PCA for dimension reduction with regression to model the relationship between OES data and etching progress. In multi-step etching processes, PCR uses the entire spectrum to detect endpoints, overcoming the limitations of single-wavelength methods.
Advantages:
- Robust to noise and small open-area changes.
- Effective for complex, multi-step etching processes.
Limitations:
- Requires training data with known endpoints.
- Computationally intensive for real-time applications.
Convolutional Neural Networks (CNNs)
CNNs have been applied to OES data for enhanced EPD, particularly in advanced semiconductor nodes. By performing feature extraction on spectral data, CNNs predict optimal EPD times with high accuracy, outperforming traditional methods like support vector machines (SVMs) and Adaboost.
Advantages:
- Captures nonlinear patterns in OES data.
- High accuracy for small open-area wafers.
- Scalable to large datasets.
Limitations:
- Requires significant computational resources and training data.
- Less interpretable than statistical methods.
Comparison of Endpoint Detection Techniques
| Technique | Approach | Accuracy | Robustness to Noise | Computational Complexity | Applications |
|---|---|---|---|---|---|
| PCR | Statistical (PCA + Regression) | High | Moderate | Moderate | Multi-Step Etching |
| CNN | Machine Learning | Very High | High | High | Advanced Nodes, Small Open Areas |
| Single Wavelength | Heuristic | Low | Low | Low | Simple Processes |
| SPS + Wavelet | Signal Processing | Moderate | High | Low | Small Open Areas |
Applications of Multivariable OES Data Analysis
Virtual Metrology
Virtual metrology (VM) uses OES data to predict process outcomes, such as etch rate or critical dimension (CD), without physical measurements. VM reduces the need for costly metrology steps, enabling real-time process optimization. Techniques like IIRR and ISR have been successfully applied to VM, with IIRR achieving accurate etch rate predictions in semiconductor manufacturing.
Process Monitoring and Control
OES-based process monitoring ensures that etching parameters remain within acceptable limits. SRA and Isolation Forest enable real-time fault detection, while PCR and CNNs support precise endpoint detection. These methods contribute to automated control systems that adjust process parameters (e.g., RF power, gas flow) in response to OES data.
Advanced Semiconductor Nodes
As semiconductor nodes shrink to 3 nm and below, OES data analysis becomes increasingly critical for achieving atomic-scale precision. Techniques like CNNs and PI-VM (Plasma Information-based Virtual Metrology) address the challenges of complex architectures and small open areas, enhancing process prediction accuracy.
Challenges in Multivariable OES Data Analysis
Data Quality and Noise
Noise from CCD detectors and environmental factors can obscure spectral features, degrading the performance of analysis techniques. Preprocessing methods, such as wavelet transforms and discrete wavelet transform (DWT), are essential for noise reduction but add computational overhead.
High Dimensionality and Redundancy
The high dimensionality of OES data requires robust dimension reduction techniques to avoid overfitting and computational bottlenecks. While methods like IIRR and PCA are effective, they must balance information retention with interpretability.
Interpretability
Many multivariable techniques, such as PCA and autoencoders, produce abstract features that are difficult to interpret in the context of plasma chemistry. Methods like IIRR and ISR prioritize physical interpretability, but their adoption is limited by computational complexity.
Real-Time Implementation
Real-time analysis is critical for fault detection and endpoint detection, but the computational complexity of advanced techniques (e.g., CNNs, Isolation Forest) poses challenges for implementation on industrial etching systems. Hardware acceleration and optimized algorithms are needed to meet real-time requirements.
Scalability to New Materials and Processes
The introduction of new materials (e.g., SiC, GaN) and 3D architectures requires OES analysis techniques to adapt to different plasma chemistries and etching behaviors. Current methods may require retraining or redesign to accommodate these changes.
Future Directions
Machine Learning and AI Integration
The integration of machine learning and artificial intelligence (AI) offers significant potential for advancing OES data analysis. Deep learning techniques, such as recurrent neural networks (RNNs) and transformers, could capture temporal dependencies in OES time-series data, improving fault detection and process modeling. However, these methods require large, annotated datasets and robust validation to ensure reliability in industrial settings.
Hybrid Approaches
Combining statistical methods (e.g., PCA, IIRR) with machine learning (e.g., CNNs, Isolation Forest) could leverage the strengths of both paradigms. For example, IIRR could be used for initial dimension reduction, followed by CNN-based endpoint detection, balancing interpretability and accuracy.
Real-Time Hardware Acceleration
Advancements in hardware, such as field-programmable gate arrays (FPGAs) and graphics processing units (GPUs), could enable real-time implementation of complex OES analysis techniques. These technologies would support the deployment of AI-driven process control in high-throughput manufacturing environments.
Standardization and Benchmarking
The lack of standardized datasets and benchmarks for OES data analysis hinders method comparison and adoption. Collaborative efforts to create open-access OES datasets and standardized evaluation metrics would accelerate research and industrial implementation.
Sustainability and Environmental Considerations
As the semiconductor industry faces scrutiny over its environmental impact, OES data analysis could contribute to sustainability by optimizing etching processes to reduce energy consumption and greenhouse gas emissions. Techniques like SRA and PI-VM could minimize faulty processing, reducing waste and improving resource efficiency.
Conclusion
Multivariable OES data analysis is a cornerstone of modern semiconductor plasma etching, enabling precise monitoring and control of complex processes. Techniques such as PCA, IIRR, SRA, and CNNs address the challenges of high-dimensional, noisy OES data, supporting applications like virtual metrology, fault detection, and endpoint detection. While significant progress has been made, challenges related to noise, interpretability, and real-time implementation persist. Future advancements in machine learning, hardware acceleration, and standardization promise to further enhance the capabilities of OES-based analysis, ensuring its continued relevance in the era of advanced semiconductor manufacturing.
This article has provided a comprehensive overview of the principles, methods, applications, and challenges of multivariable OES data analysis, with detailed comparisons to guide researchers and practitioners. As the semiconductor industry evolves, OES data analysis will remain a critical tool for achieving the precision and reliability required for next-generation microelectronics.